
Understanding and Calculating Standard Deviation
Comprehensive Definition, Description, Examples & Rules
Introduction
A standard deviation can be considered a measure of data dispersion around its mean. A small or low standard deviation will indicate that the data is clustered around the mean. In contrast, a high or large standard deviation indicates that the data is more spread across the mean. The standard deviation is a very important concept in determining the data points and sets, which is the primary use day in determining unit economics.
It is primarily used for the measurement of statistical analysis and shows the variation from the average mean. Calculating the standard deviation is always possible in positive units and the standard deviation value can never be negative as it uses a square root. Hence, the value always transfers into a positive figure, and the formula cannot be denoted as a negative unit.
Standard deviation is an essential statistical major because:
- The standard deviation is an overall summary of the measure of differences among each observation from the mean.
- If all the differences among the mean are added up, then the positive balance will be equally equivalent to the negative balance, making the sum zero.
- If the squares of all the differences are added, then the positive and negative balances will also be equal to zero, making it an effective statistical measure.
- Determining the performance of the data point is essential, which is possible through standard deviation.
- As the value of the standard deviation is always positive, determining the data set and its standard deviation is always easy as the value is always positive, and the negative denotation of the formula is impossible.
How to Calculate Standard Deviation?
The standard deviation is the degree of dispersion of data points, which is related to its mean and descriptive statistics. For both the population and sample standard deviation, the values are spread across data samples, and the measures of the variance of the data points are from its mean.
The standard deviation of the data set sample is equal to a statistical population of probability distribution through the square root of its variance. The number of observations through the main deviation of the mean value is determined through a particular formula for both the population of the sample deviation.
The step-by-step process of calculation of the standard deviation is:
- Finding the mean
- Calculating the square of its distance to the mean for all data points.
- Summation of the values of the second step.
- Dividing the number of data points and obtaining the standard deviation.
These are the basic steps you must follow before calculating both the population standard deviation and the sample standard deviation formulas, and they will help you determine the exact values of the variance you want to determine. You also have to consider specific mathematical formulas in these situations, which will help you give a precise variance value.
Example
Calculate the Standard Deviation of the following Data Set
xi | 6 | 10 | 12 | 14 | 24 |
|---|---|---|---|---|---|
fi | 2 | 3 | 4 | 5 | 4 |
Solution
Calculating the mean: (6 × 2 + 10 × 3 + 12 × 4 + 14 × 5 + 24 × 4)/(2+3+4+5+4) = 14.22
xi | fi | fixi | xi - ¯x | (xi - ¯x)2 | fi(xi - ¯x)2 |
|---|---|---|---|---|---|
6 | 2 | 12 | -8.22 | 67.5684 | 135.1368 |
10 | 3 | 24 | -4.22 | 17.8084 | 53.4252 |
12 | 4 | 40 | -2.22 | 4.9284 | 19.7136 |
14 | 5 | 60 | -0.22 | 0.0484 | 0.242 |
24 | 4 | 56 | 9.78 | 95.6484 | 382.5936 |
Using the Formula
= 1/18 × 591.1112 = 32.83
Calculate SD: σ = √Variance = √32.83 = 5.73
So, the Standard Deviation is 5.73.
Standard Deviation Formula
The formula to calculate the standard deviation for sample data is:
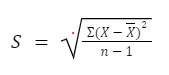
X here is the data distribution.
x is the sample mean of the equation.
n is the total number of observations.
The formula for calculating the standard deviation for population data is: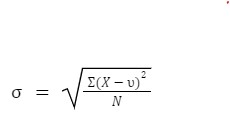
X is the value of the data distribution.
is the population mean of the equation.
N is the total number of observations.
Both these formulas are extremely similar apart from their denominator. All the data values present in the population mean are not considered through the sample means, so it is just an estimation of the population mean but introduces a certain uncertainty in calculations of the standard deviation.
The primary components of the standard deviation formulas are:
- First should be the calculation of the arithmetic mean of the data set.
- Then, the x is the difference of the mean.
- The next component is to find the average of the square differences.
- Finally, the variance will help to find the standard deviation.
Sample vs Population Standard Deviation
There is no effective difference between the population and the sample standard deviation formula, as in the population formula, you divide the entire data set by the number of data sets. In contrast, you divide the total number of data sets minus 1 in sample standard deviation. The sample standard deviation and the population standard deviation will give similar answers for the standard deviation variance, and the calculation of the data sets will also be similar when using both formulas.
A population data set is the entire group you want to conclude, while a sample set is the specific group that will be collected. For bigger, precise calculations, you need to use the population standard deviation, while for simple calculations, you might use the sample standard deviation.
Distribution of Sample Standard Deviation
The sample standard distribution is a standard deviation that measures how much the sample statistics might vary from one sample to the other. It is comparatively smaller than the population’s standard deviation by a factor and has an average, less variable than the individual observations.
The sample standard deviation might have different results as it cannot provide exact equations of data sets, and the implications of these variations might be different according to different variances. The calculation of the sample standard deviation could be more precise but has effective calculations.
Step Up Your Math Game Today!
Free sign-up for a personalised dashboard, learning tools, and unlimited possibilities!

Key Takeaways
- The standard deviation is a necessary calculation used to measure the dispersion of data through its mean.
- If it is a low or small standard deviation, it will indicate that the data is clustered across the mean. At the same time, if it is a high or large standard deviation, it will directly indicate that the data is widely spread across the mean.
- The value of the standard deviation can never be expressed as negative figures because the calculation happens in square units, and determining the data positive units and positive data sets is necessary.
- The standard deviation calculation is possible within two types, which are the population standard deviation and the sample standard deviation, making both types essential for calculating the standard deviation.
- If calculating through bigger data sets, then the population standard deviation is effective, while calculating through smaller data means that sample deviation is more effective.
Quiz
Question comes here
Frequently Asked Questions
No, the standard deviation can’t have a negative value as the measure of the variation in the data set is calculated in the square root of the variance, so there is no possibility of any calculation of negative figures due to the square root. Due to the variance, the mean of square differences will always be non-negative.
Through mean deviation, we can directly assume that all the deviations are positive in standard deviation, and these values are informed of the square, so they can’t be negative. It is one of the honest assumptions through standard deviation. There is no unnecessary exemption or false limitation regarding the standard deviation as its calculation is accurate. The sample standard deviation of distribution might not be precise in certain situations, and the degree of accuracy of the standard deviation result might differ in the case of sample standard deviation.
The standard deviation calculation is the primary part of measuring data distance dispersion, but the other method for calculating is the mean average of the mean absolute deviation. The mean average method is considered the perfect alternative for standard deviation as it is used in special financial markets and frequently calculates the varience to the standard deviation.