
The Describe Image in PTE is the third prompt type task type in the speaking section. And while many concentrate on preparing well for the other segments, the Describe Image task in PTE does not get the same attention. Read on to get tested techniques for PTE Describe Image task practice.
Getting a decent score in PTE might not seem like a tremendous task, but if you are aiming for a great opportunity abroad, then just an average score will not help you. It is just blasphemy to think that prep for specific tasks is not as important as the others. Many feel that tasks like Describe Image in PTE do not require much effort and can be handled easily. But Describe Image can be one of the most challenging aspects of PTE.

What is Describe Image in PTE?
Describe Image for Pearson PTE: Pearson English Language Tests demand rigorous prep; you have to describe the critical information in an image, a graph, a series of graphs, pie charts, a diagram, a table, or a map in less than 40 seconds. You get 25 seconds to prepare before speaking.
How to answer describe image in PTE?
We all have done descriptive writing in our English classes, but describing an image while speaking is a different ball game.
PTE evaluation algorithm checks you for your sentence structure and paragraph formation. Therefore, the best way to describe an image in PTE or chart with the right answer is to present it in three parts:
- An introductory statement
- The key highlights
- The conclusion
Different types of PTE describe images
In the PTE exam, you will encounter different types of PTE images, such as:
- Bar Graph
- Line graph
- Maps
- Tables
- Venn Diagram
- Flowchart diagram
- Pie Chart
- Pictures
What mistakes do we usually make in describe image task in PTE?
While interacting with the students, our English language trainers found that most of them had the same issues regarding the task. These issues crop up because we forget that speaking to someone is different from speaking during a test. Your Describe Image in PTE answers will be appropriate if you keep in mind the following:
How is describe image task scored?
PTE is a computer-based test with set criteria to assess you regarding the described image task. These include speed and rhythm of speech, voice quality, intonation, word choice, and pronunciation.
Your speaking ability is evaluated on three significant factors in Describe Image in PTE tasks.
They are Content, Pronunciation, and Oral Fluency.
Content: You will be scored on a scale of 0 to 5. The more components you describe from the image, the higher your score will be. Your sentence structure and the terminologies you employ for the graph/image will determine your score.
Pronunciation and Oral Fluency: The pace of your speaking, your pauses, intonation, tone and your near-native-like pronunciation of English will fix your score for these two criteria. The ease with which you speak the language gets you a good score too. Both of them carry five marks each.
PTE describe image sample answers
Describe Image PTE templates with answers are a saviour if you struggle to make sentences for Describe Image in PTE practice. Our experts have created the best templates for different types of images that you can get in the test.
Bar Graph
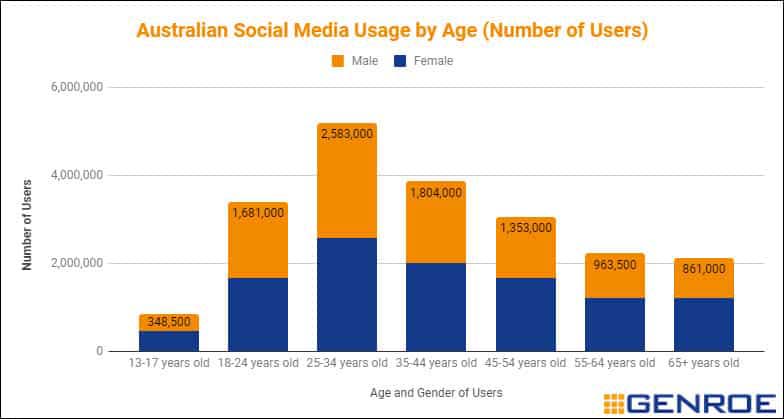
The bar graph showcases the Social Media usage in Australia by age and gender. It can be discerned that the age group of 25-34 years spend the most time on social media with the number of users being 2,583,000.Teenagers and old people clearly are the ones spending the least amount of time on social sites with the numbers 248,500 and 861,000 respectively. Interestingly, there is not a huge difference between the genders when it comes to accessing social media. I can however see that among teenagers and old age people, more females spend time on social media compared to their male counterparts.
Overall, I can conclude that this graph illustrates crucial information and justifies that people in Australia spend considerable time on social media.
Template for the Bar Graph in Describe Image PTE
- The bar graph reveals/ represents (TOPIC) and (CATEGORIES SHOWN)
- The chart clearly states that the (HIGHEST DATA SHOWN) is (NAME OF THE CATEGORY) , which is (THE FIGURE).
- On the other hand (LOWEST DATA SHOWN) is (NAME OF THE CATEGORY) , with the figure of (FIGURE).
- In conclusion, I can clearly say that (SIMILARITIES/DIFFERENCES/TRENDS)
Pie Chart
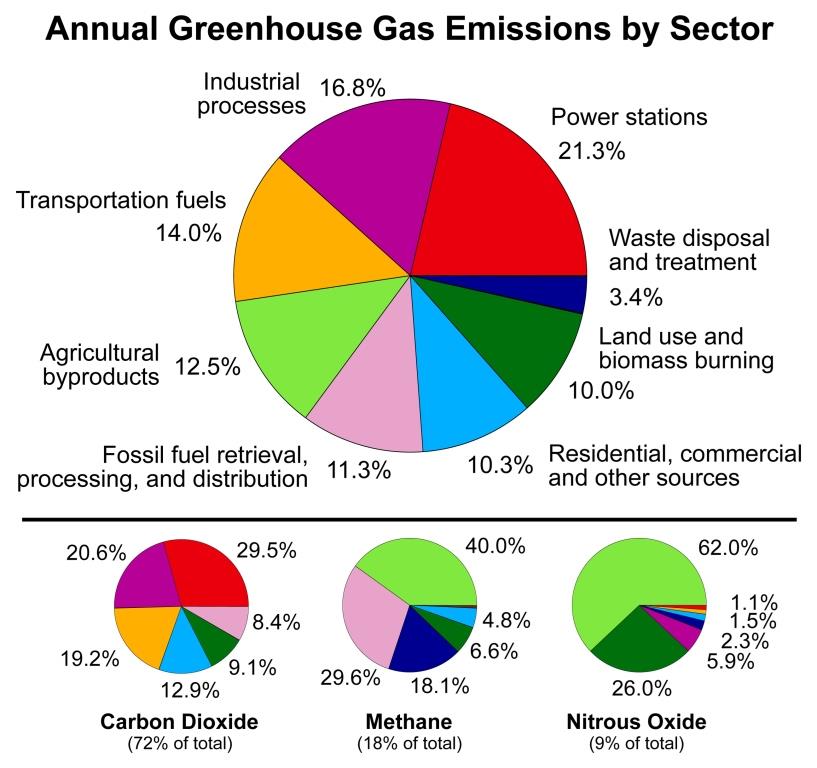
The pie chart reveals the annual greenhouse gas emissions by different sectors. Upon observing the chart, I can deduce that power stations have the largest share of emitting greenhouse gas, 21.3%, than any other sector . Similarly, industrial processes and transportation fuels also contribute heavily with the figures of 16.8% and 14.0 % respectively, to greenhouse emissions. Interestingly, agriculture by products too generate a sizable share of 12.5%. Waste disposal and treatment has the least share of 3.4% in the emissions.
In conclusion, I can say that the figure above provides vital information regarding the contributors of greenhouse gas emissions.
Template for the Pie Chart in Describe Image
This template is similar to the bar graph template.
- The pie chart projects/reveals (TITLE) and (CATEGORIES)
- I can discern that the highest is (NAME OF THE CATEGORY) with a (FIGURE), followed by (NAME OF THE CATEGORY) with a share of (FIGURE)
- Overall I can safely conclude that (TREND/HIGHEST/LOWEST/DIFFERENCE/SIMILARITY)
Line Graph

The line chart gives projects the information regarding the increase in the cyber crime in India in the past decade. Based on my observations of the chart from 2010 to 2018, I can see a great variation in the figures. The crime rate increased sharply from 2016 and peaked at 27,248 cases in 2018. Before that there had been a steady increase from 966 cases in 2010 to around 12,000 cases in 2016. I can locate an incline from 2013. It can be clearly stated that never was there a decline in the number of cyber crime cases.
Consequently, I can conclude that the data shown is pivotal in providing information regarding the exponential increase of cyber crime in India.
Template for the Line Graph in Describe Image
Line graphs are easier to understand and speak about. Use the following template.
- The line graph showcases (TOPIC)
- There has been a steady rise in (CATEGORY) which peaked at (FIGURE)
- The (CATEGORY) fell sharply to a low of (FIGURE)
- The (CATEGORY) varied from (FIGURE) to (FIGURE)
- It gradually increased/decreased to (FIGURE)
Image

The image I see looks fascinating and interesting. It is a plain balck and white image but it has a lot of depth. The highlight of the image is an old man, who is standing in a store. I can observe books neatly arranged in book racks. There are several rows and the image clearly depicts the man tilting his head to read the titles of the books. There are books behind the old man as well. In the background I can locate other people in the book shop. Also noticeable is a shopping bag that the man has kept next to him on the tiled floor of the shop.
It is not false to conclude that the image shows a person deciding on which book to purchase.
Template for the Image in Describe Image PTE
- The given image is captivating. It shows……..
- The variation in subjects/colours is fascinating. There are….
- An analysis of the image also reveals ……..
- In addition to this, the image also highlights …….
- I can conclude by saying that …..
Tips and tricks to describe image in PTE
Our experience and research regarding PTE prep has led us to the most repeated Describe Image tasks in PTE. Therefore, we have created effective strategies so that you have the best prep possible.
- Speak. Don't Stop
The Speaking Test assess your verbal ability to express. So whether you can completely understand an image or not, speak as much as you can about it.
- Don't speak for 40 seconds
You do not have to drag the sentences to speak for the complete time duration. Time yourself so that you stop speaking by 35-36 seconds. If you push yourself to talk for 40 seconds, you may make mistakes or miss out on speaking the proper conclusion.
- Avoid fillers
Umms.. and urrs.. are strictly avoided as the machine will take it as a lack of preparation and vocabulary. Furthermore, you are being tested for your speaking skills in the English language, so you cannot speak casually.
- Practice, Practice, Practice
Check out images, graphs, and diagrams online, in magazines and newspapers for Describe Image PTE practice. Make sentences and speak. Jot down any words or terms you think are good while discussing graphs and use them. You will gain confidence and reduce your chance of making mistakes.Time yourself by keeping:
- 9-10 seconds for introduction
- 19-20 seconds for the main points of the image/graph
- 5-6 seconds for the conclusion
- Highlight the main points
Scan the information reflected in the graph/image. Check out the highest and the lowest data provided, any changing trends, and any other aspect of the data that you feel is significant. Make your sentences accordingly.
- Enrol for PTE Speaking course
Do not hesitate to take up a PTE study online training course for your test prep. More and more test givers are turning to online learning. Online classes by Edulyte offer guidance regarding the fundamentals of the test and how to score well in each segment. In addition, you get advice from qualified mentors and can learn at your own pace, anywhere, anytime. All this, of course, saves you money! In addition, we offer special modules, including for Describe Image PTE template with answers.
Conclusion
PTE isn’t a tough test if you have the right game plan. You must dedicate time for prep and work consistently to improve upon your mistakes. It always helps to have experts in the field guiding you and finding the right solutions to your problems regarding the prep. Contact Edulyte to find out more about how personalised training can get you a great score in PTE.
Other relevant links for PTE candidates
- Our Detailed Guide for PTE
- Read Aloud in PTE
- Writing Essay
- Full Form of PTE
- Score Chart
- Booking Your PTE Test
More PTE Blogs For You
Learning lessons, study tips, career guides and much more!


PTE can give you several graphs and images or diagrams for the Describe Image task. You must be aware of the different types of graphs and how to read them while preparing for the PTE. The types of graphs usually given in the test are:
- Bar Chart
- Pie Chart
- Line Chart
- Table
- Others – Flow Chart, Map, Mixed Chart, Picture, etc.
If you have a template for the pie chart description, it is a breeze to describe it. Follow the template below for Pie Chart description:
- The pie chart projects/reveals (TITLE) and (CATEGORIES).
- I can discern that the highest is (NAME OF THE CATEGORY) with a (FIGURE), followed by (NAME OF THE CATEGORY) with a share of (FIGURE)
- Overall I can safely conclude that (TREND/HIGHEST/LOWEST/DIFFERENCE/SIMILARITY)
Your speaking ability is evaluated on three significant factors in Describe Image questions. They are Content, Pronunciation, and Oral Fluency.
Content: You will be scored on a scale of 0 to 5. The more components from the image you describe, the higher your score will be. Your sentence structure and the terminologies you employ for the graph/image will determine your score.
Pronunciation and Oral Fluency: The pace of your speaking, your pauses, intonation, tone and your near native-like pronunciation of English will fix your score for these two criteria. Both of them carry five marks each.
You can achieve a high score if you follow the below-mentioned methods diligently:
Speak. Don’t Stop
The Speaking Test tests your verbal ability to express. So whether you can completely understand an image or not, speak as much as you can about it.
Don’t speak for 40 seconds.
You do not have to drag the sentences to speak for the complete time duration. Time yourself so that you stop speaking by 35-36 seconds. If you push yourself to talk for 40 seconds, you may make mistakes or miss out on speaking the proper conclusion.
Avoid fillers
Umms.. and urrs.. are strictly avoided as the computer will take it as a lack of preparation and vocabulary. You are being tested for your speaking skills in the English language, so you cannot speak casually.
Practice and Practice
Check out images, graphs, and diagrams online, in magazines and in newspapers. Make sentences and speak. Jot down any words or terms you think are good while discussing charts and use them. You will gain confidence and reduce your chance of making mistakes. Time yourself by keeping:
- 9-10 seconds for introduction
- 19-20 seconds for the main points of the image/graph
- 5-6 seconds for the conclusion
Enrol for PTE Speaking course
Do not hesitate to take up a PTE study online training course for your test prep. More and more test givers are turning to online learning. Online classes by Edulyte offer guidance regarding the fundamentals of the test and how to score well in each segment. In addition, you get advice from qualified mentors and can learn at your own pace, anywhere, anytime. All this, of course, saves you money!
Highlight the main points
Scan the information reflected in the graph/image. Check out the highest and the lowest data provided, any changing trends, and any other aspect of the data that you feel is significant. Make your sentences accordingly.
The description of an image in Describe Image in PTE can be as follows:
- The given image is captivating. It shows……..
- The variation in subjects/colours is fascinating. There are….
- An analysis of the image also reveals ……..
- In addition to this, the image also highlights …….
- I can conclude by saying that …..
The PTE is divided into 3 segments:
- Speaking and Writing
- Reading
- Listening
Edulyte has qualified trainers who will guide you through personalised training. You will be supported at each step through innovative techniques and internet-enabled tools. Based on your progress the modules are designed and redesigned.
There are intensive and skill-specific courses that enable you to learn at your own pace. Learner satisfaction is our utmost priority, and our team constantly works towards it.