PTE exam preparation involves many aspects, and you need to be aware of all the crucial details about the PTE...
Read MoreMastering PTE Describe Image Templates and Strategies
The Pearson Test of English (PTE) has challenges to test your language skills. Among these, the Describe Image task demands linguistic finesse and an analytical eye. That is why you require a Describe Image template for PTE to ensure a brilliant performance. The Describe Image PTE template with answers is a lifesaver for anyone preparing for PTE.
Introduction to PTE Describe the Image: What is it and Why is it Significant for Your PTE Score?
But why is PTE Describe the Image task so significant?
In today’s data-driven world, deciphering and articulating information from visuals is crucial. The “Describe Image” task in PTE prepares you for these real-world challenges by nurturing skills like observation, analysis, and communication.
When you are faced with an image, you’ll need to describe what you see and synthesise the information it conveys. It means discussing the central theme, the relationships between elements, and any emerging trends or patterns. And you will have to do this in 40 seconds.
The Describe image is preparing you for a world where images speak volumes
PTE Describe Image Templates with Sample Answers: Your Ultimate Guide to Describe Image Response
Edulyte gives not only one template for PTE Describe Image but many! PTE Speaking Describe Image template gives you the right way to get your responses ready.
Simplified Template for Describe Image PTE

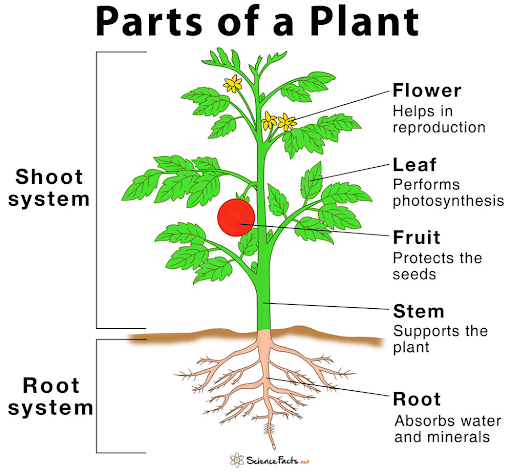
The given image shows the significant parts of a plant, alongwith their critical functions. Looking closely at the image, I can deduce that the plant system can be divided into two major segments: the root system and the shoot system.
The root system in the plant displayed in the image, comprises roots that absorb water and minerals. Moving on, the shoot system consists of the stem of the plant, its leaves, fruits and flowers.
From the illustration, I can clearly discern that the stem supports the plant, whereas the leaves perform the photosynthesis.The flower plays a crucial role in reproduction. The image highlights the role of fruits as protectors of seeds.
I can conclusively say that the image portrays the parts of a plant in a clear manner.
Template for the Image in Describe Image PTE
- The given image is captivating. It shows……..
- The variation in subjects/colours is fascinating. There are….
- An analysis of the image also reveals ……..
- In addition to this, the image also highlights …….
- I can conclude by saying that …..
Strategies for Effective Image Description: Proven Guidelines for Better Scores
PTE image description template should be handled with few master techniques. Some time-tested strategies to help you analyse the images with are:
- Start with an Overview: Mention what the image represents, its title or context (if available), and any significant details immediately catching your eye.
- Break It Down Methodically: Divide the image into sections or components and describe each part separately.
- Identify Key Trends and Patterns: Look for patterns, trends, or outliers in the data, especially in graphs and charts. Highlight these observations to demonstrate your analytical skills.
- Use Precise Language: Choose your words carefully and be as precise as possible. Instead of saying “a lot” or “many,” provide specific quantities or percentages to convey the information accurately.
- Quantify and Compare: Provide quantitative data to support your description whenever applicable. Use phrases like “the chart shows a significant increase of 20%” or “the bar graph illustrates a clear contrast between X and Y.”
- Use Linking Words: Phrases like “Furthermore,” “In addition,” “Conversely,” and “On the contrary” can help you smoothly transition between different aspects of the image.
- Practice Conciseness: Remember you have limited time, so avoid unnecessary repetition or elaboration.
- Practice Regularly: Work with various images, charts, graphs, and diagrams to hone your abilities. Timing yourself during practice can also help you get used to the time constraint.
Edulyte provides thousands of practice questions and resources for the Speaking section. Edulyte has updated PTE tests online to aid your preparation. Buy your package and attempt the tests and receive your scores instantaneously!
Describe Image PTE template with answers by Edulyte can steer you into a higher bracket score. Instead of googling “PTE template describe image” or “template of describe image PTE”, check out the easy template for Describe Image PTE by Edulyte.
Lecture-Based Image Description
Addressing “Describe Image” tasks based on audio-visual presentations or lectures requires a slightly different approach than static images. The Describe Image Template for PTE can be used as Lecture PTE Describe Image Template too.
- Listen Actively: Pay close attention to the spoken content of the lecture. Understand the context and key points being discussed.
- Identify the Key Image: In lecture-based tasks, multiple images or visuals will often be presented. Quickly identify the primary image or visual the speaker references, and focus your description on that specific image.
- Start with the Basics: Begin your description by introducing the lecture topic or subject matter. Mention the speaker’s name, if known, the title of the lecture, and any relevant background information that sets the stage for the image description.
- Describe the Image in Detail: Provide a detailed description of the image or visual of the task. Mention its type (e.g., chart, graph, map), colours, shapes, labels, and any data points or trends.
- Practice Listening and Speaking Together: To improve your skills in lecture-based image description, practice listening to audio presentations or lectures and describing associated visuals.
- Vocabulary and Language Skills: Build a robust vocabulary to describe images and concepts effectively.
PTE Bar Graph Description Template
PTE graph templates make you confident with creating appropriate responses with the right terminology for graph description. The PTE bar graph template given here can be modified effortlessly.

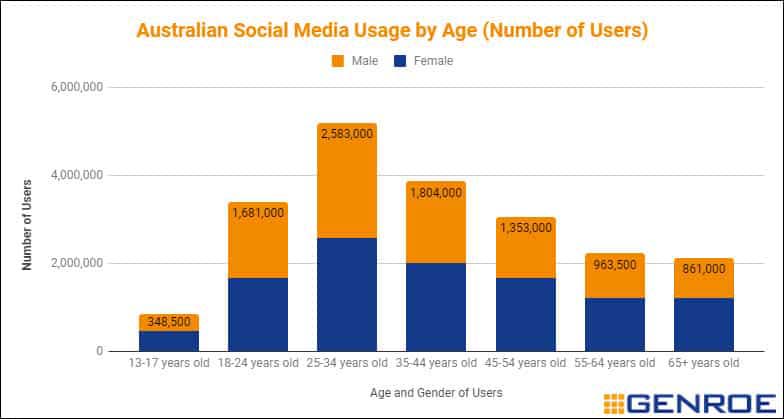
The bar graph showcases the Social Media usage in Australia by age and gender. It can be discerned that the age group of 25-34 years spend the most time on social media with the number of users being 2,583,000.Teenagers and old people clearly are the ones spending the least amount of time on social sites with the numbers 248,500 and 861,000 respectively. Interestingly, there is not a huge difference between the genders when it comes to accessing social media. I can however see that among teenagers and old age people, more females spend time on social media compared to their male counterparts.
Overall, I can conclude that this graph illustrates crucial information and justifies that people in Australia spend considerable time on social media.
Template for the Bar Graph in Describe Image PTE
- The bar graph reveals/ represents (TOPIC) and (CATEGORIES SHOWN)
- The chart clearly states that the (HIGHEST DATA SHOWN) is (NAME OF THE CATEGORY) , which is (THE FIGURE).
- On the other hand (LOWEST DATA SHOWN) is (NAME OF THE CATEGORY) , with the figure of (FIGURE).
- In conclusion, I can clearly say that (SIMILARITIES/DIFFERENCES/TRENDS)
Vocabulary and Language Tips:
- Use a variety of vocabulary to describe the data accurately. This includes words like “increase,” “decrease,” “rise,” “fall,” “fluctuate,” “peak,” and “trough.”
- Employ appropriate adjectives to convey the magnitude of changes, such as “significant,” “marginal,” “drastic,” or “gradual.”
- Utilize linking words and phrases to connect your ideas cohesively (e.g., “Furthermore,” “In addition,” “On the other hand,” “Conversely”).
- Pay attention to verb tenses when discussing changes over time.
PTE Pie Chart Description Template
The PTE pie chart template guides you on how to handle such a task in the PTE Speaking section. You can modify the given pie chart PTE template as per the task in the PTE Speaking section.

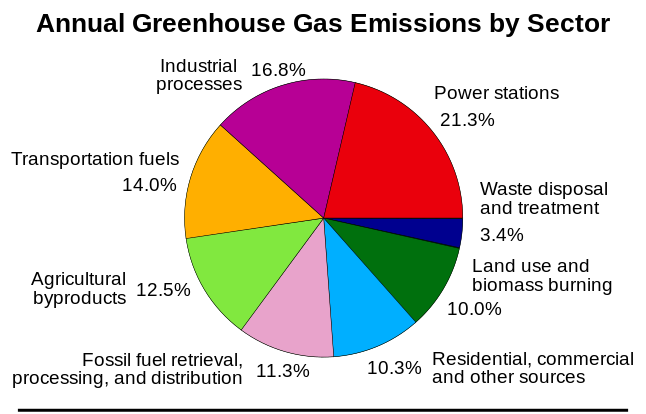
The pie chart reveals the annual greenhouse gas emissions by different sectors. Upon observing the chart, I can deduce that power stations have the largest share of emitting greenhouse gas, 21.3%, than any other sector . Similarly, industrial processes and transportation fuels also contribute heavily with the figures of 16.8% and 14.0 % respectively, to greenhouse emissions. Interestingly, agriculture by products too generate a sizable share of 12.5%. Waste disposal and treatment has the least share of 3.4% in the emissions.
In conclusion, I can say that the figure above provides vital information regarding the contributors of greenhouse gas emissions.
Template for the Pie Chart in Describe Image
This template is similar to the bar graph template.
- The pie chart projects/reveals (TITLE) and (CATEGORIES).
- I can discern that the highest is (NAME OF THE CATEGORY) with a (FIGURE), followed by (NAME OF THE CATEGORY) with a share of (FIGURE)
- Overall I can safely conclude that (TREND/HIGHEST/LOWEST/DIFFERENCE/SIMILARITY)
Vocabulary and Language Tips:
- Utilise a variety of vocabulary to accurately describe the data, including words like “represents,” “constitutes,” “accounts for,” “comprises,” and “composes.”
- Employ adjectives and adverbs to describe the distribution, such as “unequal,” “fairly even,” “disproportionate,” “significantly,” and “marginally.”
- Use linking words and phrases to connect your ideas seamlessly (e.g., “Moreover,” “In contrast,” “On the whole”).
PTE Line Graph Description Template
The PTE line graph template assists you in preparing for such a task.

The line chart gives projects the information regarding the increase in the cyber crime in India in the past decade. Based on my observations of the chart from 2010 to 2018, I can see a great variation in the figures. The crime rate increased sharply from 2016 and peaked at 27,248 cases in 2018. Before that there had been a steady increase from 966 cases in 2010 to around 12,000 cases in 2016. I can locate an incline from 2013. It can be clearly stated that never was there a decline in the number of cyber crime cases.
Consequently, I can conclude that the data shown is pivotal in providing information regarding the exponential increase of cyber crime in India.
Template for the Line Graph in Describe Image
Line graphs are easier to understand and speak about. Use the following template.
- The line graph showcases (TOPIC).
- There has been a steady rise in (CATEGORY) which peaked at (FIGURE).
- The (CATEGORY) fell sharply to a low of (FIGURE).
- The (CATEGORY) varied from (FIGURE) to (FIGURE).
- It gradually increased/decreased to (FIGURE).
Vocabulary and Language Tips:
- Use a rich vocabulary to accurately describe the data, including terms like “fluctuate,” “peak,” “trough,” “rise,” “fall,” and “stagnate.”
- Employ adjectives and adverbs to describe the intensity and direction of trends, such as “sharp,” “gradual,” “steady,” or “rapidly.”
- Utilise linking words and phrases to connect your ideas logically (e.g., “Furthermore,” “In contrast,” “Conversely”).
Utilising Templates in PTE Speaking
Utilising templates in the PTE (Pearson Test of English) Speaking section can be a valuable strategy to help you structure your responses effectively and maximise your score. Here’s how to make the best use of templates:
- Understand the Purpose of Templates: Templates are not meant to be rigid scripts you recite verbatim. Instead, they serve as frameworks to organise your thoughts and ensure you cover all necessary points in your response.
- Practice with a Variety of Templates: Familiarise yourself with different Describe Image tasks.
- Adapt Templates to the Task: Tailor your template to the specific task. Think whether you require a describe image pie chart template or describe image line graph template.
- Use Templates as Guidelines: Think of templates as guidelines rather than strict rules. While following the structure is beneficial, be flexible if the situation demands it.
Practical Application and Practice
Practical application and regular practice are essential for effectively mastering templates in the PTE Speaking section. Here are some practice exercises and image prompts to help you apply the templates for PTE graph or describe image map templates:
Describe Image Practice:
Exercise:
- Collect various images, such as bar graphs, pie charts, maps, and diagrams.
- Use the PTE Bar Graph, Pie Chart, and Diagram Description Templates provided earlier.
- Set a timer for 40 seconds for each image description.
Image Prompts:
- A bar graph depicting the sales performance of a company over five years.
- A pie chart showing the distribution of household expenses.
- A diagram illustrating the life cycle of a butterfly.
- A map highlighting the tourist attractions in a city.
Free Downloadable Templates (PDF): Get easy access and Reduce your Time and Effort for PTE Describe Image Prep
The experts at Edulyte realise that there is a dearth of good PTE Describe Image templates. They have designed a few describe image template pdf download, and you can access the PDFs here.
Frequently Asked Questions
Describe Image tasks for several compelling reasons:
- Structural Framework: Templates provide a structured framework that helps test-takers organise their thoughts and responses.
- Time Management: The “Describe Image” task in PTE has a strict 40-second time limit. Templates help manage time efficiently by allocating specific portions for the introduction, key points, and conclusion.
- Clarity and Focus: Templates assist in maintaining clarity and focus.
- Enhanced Vocabulary: Using templates encourages the use of varied vocabulary and descriptive language.
- Adaptability: Templates are adaptable to different types of images, whether it’s a bar chart, pie chart, line graph, diagram, or map.
- Scoring Benefits: Templates can help test-takers consistently meet the criteria of PTE, potentially leading to a higher score.
Handling Describe Image tasks based on lectures or presentations in the PTE Speaking section requires a slightly different approach than static images.
- Listen Actively:
Pay close attention to the audio-visual presentation or lecture.
- Identify the Key Image:
Quickly identify the primary image or visual the speaker references, and focus your description on that specific image.
- Structure Your Response:
Your structure should typically include:
- An introduction.
- A description of the image.
- An explanation of its significance in the lecture context.
- A conclusion.
- Introduction:
Begin by briefly introducing the lecture topic and the visual content.
- Describe the Image:
Provide a detailed description of the image or visual of the task. Mention its type (e.g., chart, graph, map), colours, shapes, labels, and any data points or trends.
If you have a template for the pie chart description, it is a breeze to describe it. Follow the template below for Pie Chart description:
- The pie chart projects/reveals (TITLE) and (CATEGORIES).
- I can discern that the highest is (NAME OF THE CATEGORY) with a (FIGURE), followed by (NAME OF THE CATEGORY) with a share of (FIGURE)
- Overall I can safely conclude that (TREND/HIGHEST/LOWEST/DIFFERENCE/SIMILARITY)
PTE can give you several graphs and images or diagrams for the Describe Image task. You must be aware of the different types of graphs and how to read them while preparing for the PTE. The types of graphs usually given in the test are:
- Bar Chart
- Pie Chart
- Line Chart
- Table
- Others – Flow Chart, Map, Mixed Chart, Picture, etc.
You can achieve a high score if you follow the below-mentioned methods diligently:
Speak. Don’t Stop
The Speaking Test tests your verbal ability to express. So whether you can completely understand an image or not, speak as much as you can about it.
Don’t speak for 40 seconds.
You do not have to drag the sentences to speak for the complete time duration. Time yourself so that you stop speaking by 35-36 seconds. If you push yourself to talk for 40 seconds, you may make mistakes or miss out on speaking the proper conclusion.
Avoid fillers
Umms.. and urrs.. are strictly avoided as the computer will take it as a lack of preparation and vocabulary. You are being tested for your speaking skills in the English language, so you cannot speak casually.
Practice and Practice
Check out images, graphs, and diagrams online, in magazines and in newspapers. Make sentences and speak. Jot down any words or terms you think are good while discussing charts and use them. You will gain confidence and reduce your chance of making mistakes. Time yourself by keeping:
- 9-10 seconds for introduction
- 19-20 seconds for the main points of the image/graph
- 5-6 seconds for the conclusion
You will have to register for a Pearson account on pearsonpte.com website. Once the account is created, you can schedule your test.
The PTE is divided into 3 segments:
- Speaking and Writing
- Reading
- Listening
PTE Tips: Expertly Crafted Guides for You
Dive into our PTE Tutorials, each package meticulously designed to align with distinct learner goals and preferences, ensuring you’re always on the right track.
Listening Skills for PTE: How to Excel in the Listening Section
If you are reading this blog, you have likely heard of the Pearson Test of English (PTE) Academic. It is...
Read MorePTE Speaking Section: Strategies for Fluency and Pronunciation
Embarking on your PTE journey? You must be aware of its different sections. Today, let us zero in on the...
Read MorePTE Score Chart : Explore the Method of your PTE Academic
Unlock Your Pathway to Success: Navigating PTE Score Bands for Study, Work, and Life Abroad. Your Gateway to English Proficiency...
Read MorePTE Full Form: Beyond the Letters | Unveiling the Significance
PTE is a popular and widely accepted English proficiency test worldwide. If you are attempting this test, you have come...
Read MoreThe Importance of Time Management in the PTE Exam
Time is an essence, and when you're sitting for the PTE (Pearson Test of English) exam, every second counts. Effective...
Read More


